City, County, and Regional Reports
Map Sets | City- and County-Level Reports | County-Level Reports
Map Sets |
|
 |
Map Set 2018 This map set was produced by the Alameda County Public Health Department, Community Assessment, Planning, and Evaluation (CAPE) unit. It is a collection of Alameda County maps that show health and social data at the census tract or zip code level, maps for which CAPE routinely receives requests. We work to achieve the ACPHD mission by monitoring the latest data on social and health issues affecting our county. The information is intended for policy makers, non-profit organizations, community educators, city planners, local service providers, residents, and students. These maps may be referenced or reproduced in reports, presentations, and publications with the Alameda County Public Health logo and the citation: Alameda County Public Health Department, Map Set, April 2018. Available in PDF or Powerpoint format. |
City- and County-Level Reports |
|
 |
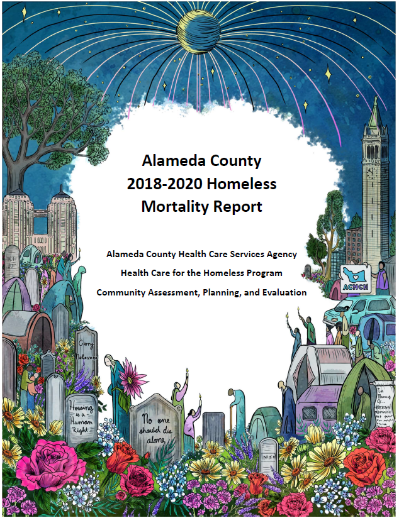
Alameda County Homeless Mortality Report, 2018-2020 The Alameda County Health Care for the Homeless (ACHCH) and Community Assessment, Planning, and Evaluation (CAPE) teams have released the county’s first-ever homeless mortality report, a retrospective report on homeless deaths from 2018 to 2020 in Alameda County. The report seeks to accurately enumerate deaths among people experiencing homelessness to inform policies and practices to reduce preventable deaths, and to reduce the harm that preventable deaths create for families, friends, caregivers, and the community. This review will help our health and housing partners develop interventions to reduce deaths among those experiencing homelessness. |
 |
Alameda County Health Data Profile 2014 The Alameda County Health Data Profile is a summary of the health status of the Alameda County population. It presents data on the key drivers of morbidity and mortality by city/place and race/ethnicity. For select indicators it also presents trends and rates by age group. Additionally, an entire chapter is dedicated to health equity: how poverty and racism impact social, economic, and health outcomes. This data profile comprises the Community Health Status Assessment component of the larger Community Health Assessment (CHA), one of the key deliverables in the Public Health Accreditation process. Based on the CDC’s model, Mobilizing for Action through Planning and Partnerships (MAPP), the data profile is intended to complement the other three components of the CHA: 1) the Local Public Health System Assessment, 2) the Community Themes and Strengths Assessment, and 3) the Forces of Change Assessment. All of these components and processes together will give rise to the community priorities that will inform the Community Health Improvement Plan (CHIP), one of the other key deliverables for accreditation. |
County-Level Reports |
|
 |
An Introduction to Measures of Mortality: Assessing Overall Health, Cause of Death Rankings, Health-Adjusted Life Expectancy, and Socioeconomic Conditions in Alameda County This paper explores many ways of looking at mortality data for Alameda County, beginning with all-cause mortality rate and life expectancy. Next, to look at cause-specific mortality, four statistics are compared side by side—leading causes of death, cause-specific mortality rates, years of life lost (YLL), and potential gains in life expectancy (PGLE) due to eliminating specific causes of death. The modified health-adjusted life expectancy (HALE), or years of expected disability-free life, is also presented. Finally, some mortality data related to socioeconomic measures are included—life expectancy by neighborhood poverty, life expectancy by nativity, and mortality rate by education. |
